
Leveraging Braking Data to Predict Rear-End Collisions: A Road Safety Initiative in Zurich
Discover how Zurich is using vehicle braking pressure data to proactively identify and mitigate rear-end collision risks, improving road safety citywide.

%20copy.png)
📩 Stay updated on industry trends & Vianova product updates—subscribe to our Newsletter here!
Introduction
Collisions are thankfully quite rare in Kanton Zurich. The WHO declared Switzerland the safest country worldwide (of those with over a million inhabitants) when looking at the number of road deaths per capita in a report from 2018, and Zurich is no exception to that rule. This record is in no small part due to the work of Dr. Wernher Brucks, who has been the city’s road safety manager since 2006.
Several years into his tenure, bike and scooter sharing services arrived in Zurich. Dr. Brucks saw a gap between the existing infrastructure and the needs of these new vehicles - a risk to his city’s high safety standards. He thus teamed up with Vianova to monitor and regulate the newcomers. After years of successful collaboration, Vianova decided to step out of the micro mobility-sandbox and tackle Dr. Brucks’ home turf, road safety. The goal is to apply its expertise in visualising large quantities of GIS data to an area where, traditionally, qualitative data prevails.
The reasoning goes as follows: 1) Crashes happen where people show risky driving behaviour, 2) Risky driving behaviour is partly caused by characteristics of the road one is driving on and thus occurs geographically concentrated, 3) With the abundance of car data at our disposal we can identify hotspots for risky behaviour and hence potential accidents. This hypothesis is intuitive in theory but hard to implement in practice: Accidents usually happen for a few specific reasons rather than an accumulation of rough indicators. Predicting single instances is virtually impossible due to the relative rarity of accidents. Instead, we try to find an indicator for risky road segments.
Setup
To achieve specificity in our analysis, we focus on one common type of crash: rear-end collisions. As a first step, we try to find a metric that is especially present in areas which are known to experience a lot of these events. The intensity of this metric would indicate risk in this context. The second step is to test whether there is any predictive power in this metric: Would other areas with a high intensity also prove to experience a lot of rear-end collisions?
Existing Hotspots
The city of Zurich provided us with 7 locations across the city which have been hotspots for those collisions over the last five years (Map 1). All of these hotspots were located either on intersections, ramps or merging lanes.
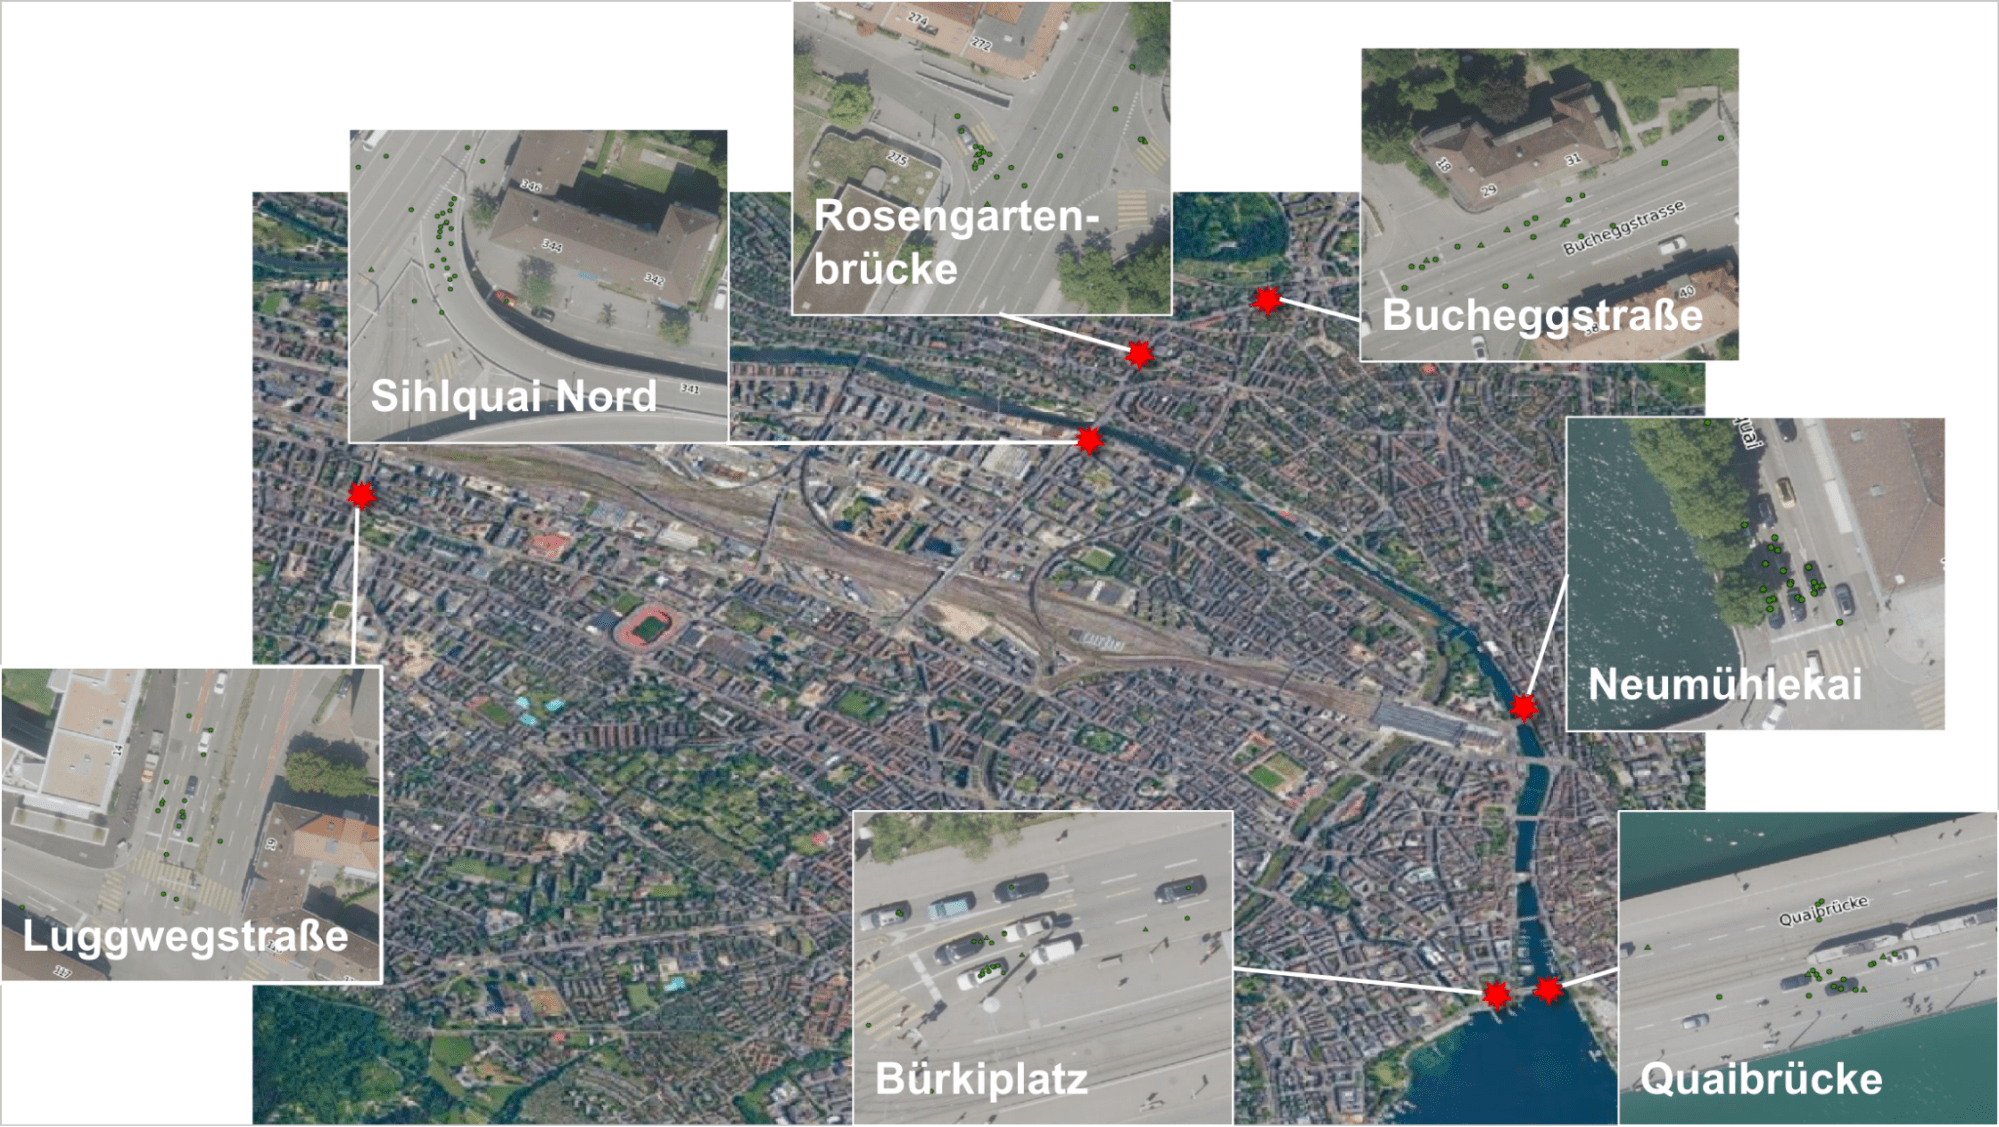
These roads are by nature more prone to rear-end collisions than an average street segment. To account for this, we compared them to a control group: not in a precise scientific sense, but simply by looking at the neighbouring segments, many of which are also ramps, intersections and merging lanes.
After testing the occurrence of very heavy breaking in these areas, we would hopefully see a higher density among the known hotspot segments.
Connected Vehicle Data
The data also provide speed of the vehicle, the date and other information. However, we will limit descriptives to the variable of interest, which is breaking pressure. The following table shows the distribution of this variable among the road segments inside our first test zones. A breaking pressure above 10 is usually considered harsh braking, putting about 16% of our observed events into this category. Additionally, I introduced two more categories, at a braking pressure of 20 and 30, with the respective share noted in the table underneath. The events of the heaviest braking category make up only slightly above 3% of the overall braking events. We are therefore looking at a quite specific and rare event. At the same time, the total count (around 2.7k) is still a multiple of the total count of collisions.
.png)
Results
The breaking pressure showed a high correlation with historical accidents in several ways, one of which stood out: The very heavy braking category with a braking pressure of over 30. Taking only values over 30 and considering these as “extremely harsh breaking”, the coincidence of places with frequent occurrences of this event and historic records of rear-end collisions is the highest among the three observed categories.
The following map shows the frequency of very harsh braking events (over 30) per street segment: The darker the segment, the overall number of such events were observed.
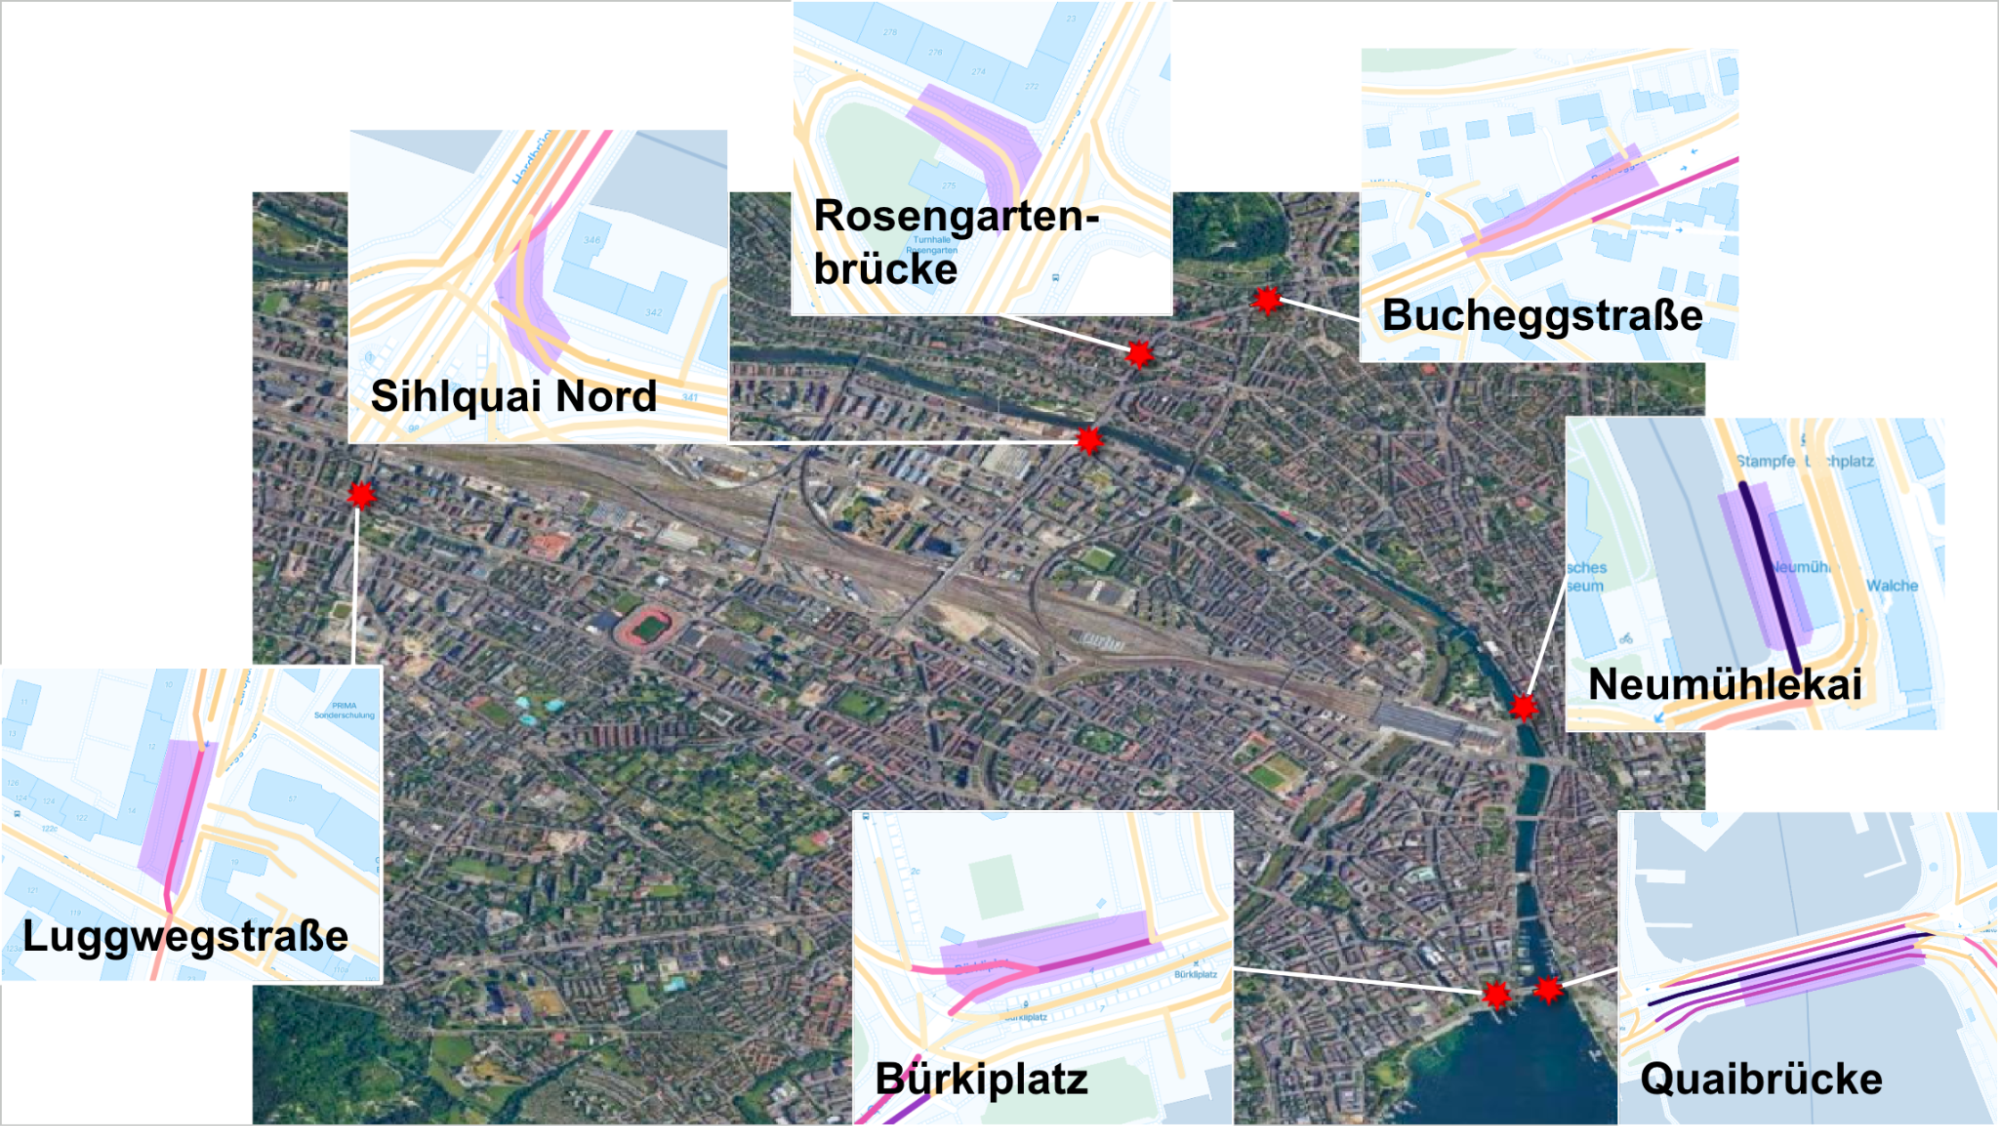
5 out of 7 hotspots showed a clearly increased frequency of very heavy breaking events compared to the surrounding road segments. The surrounding road segments are often of similar type, i.e. ramps and merging lanes, which makes it a meaningful control group and the result relevant.
What is also noteworthy is that these segments did not show particularly high values in other potential risk indicators such as overspeeding. To the contrary, average speed was higher on the surrounding segments than on the hotspot segment. This situation is likely explained by the fact that speed and rapid deceleration are not always related.
Now for the final part of the study, we had to test whether our methodology would also work on unknown hotspots. To that end, we determined 7 road segments across the city which showed frequent very harsh braking events. Without knowing which other locations experienced increased numbers of rear-end collisions, we presented the selected segments to Dr. Wernher Brucks and asked for his opinion.
The underlying map shows the selection of road segments which were selected for the feedback cycle: They all showed over 200 very harsh braking events in the observed period.
Discussing these newly identified “risk hotspots” with Dr. Brucks, he acknowledged that some of them indeed had a higher incidence of rear-end collisions than just any road segment. However, the reasons were often clear from the design and location of the streets: Many of them include infrastructure elements such as traffic lights, pedestrian crossings or ramps. Hotspots for rear-end collisions which did not show these characteristics could not consistently be detected based on braking pressure alone. Furthermore, there is potential to explore the difference between absolute and relative frequency of heavy braking events: According to Dr. Brucks, the latter category is the more interesting one, as it is more likely to represent a blind spot from a traffic manager perspective.
Conclusion
Our study successfully identified a correlation between very heavy braking events and rear-end collisions in Zurich. While this is a promising start for further research, there are continuing opportunities to improve the quality of our data products. . The lessons learned can be subsumed under two main points:
1. Identification of Risky Road Segments: By leveraging vehicle braking pressure data, we pinpointed specific road segments with a high frequency of very heavy braking events, notably those with pressures over 30. This metric proved to be a reliable indicator of rear-end collision risk, establishing a meaningful relationship between floating car data (FCD) events and collisions that is relevant for ongoing analysis.
2. Proactive Risk Identification: Further investigation can extend our methodology to identify areas where collisions have not yet occurred but where risk factors are present. This proactive approach can enhance road safety by addressing potential hazards before accidents happen.
To learn more about the methodology associated with our data products, our white papers explain both our philosophical and technical approaches.
Ready to learn more?
Reach out for a product demo or to get more information on how 100+ cities around the world are using Vianova’s tools to turn mobility data into actionable insights. Visit our page to get in touch!
👉 Read our previous blog here!
.png)


Become part
of the movement
in the Vianova world.
Let's get in touch
Lets talk! We are excited to hear how we can help you solve your mobility challenges.