

A Data Ecosystem Powering Intelligence
at Scale
Flexible integration with 150+ mobility data sources lets you connect any dataset, enrich analysis, and collaborate at scale


Trusted by mobility data partners worldwide


_layerstyle.svg)


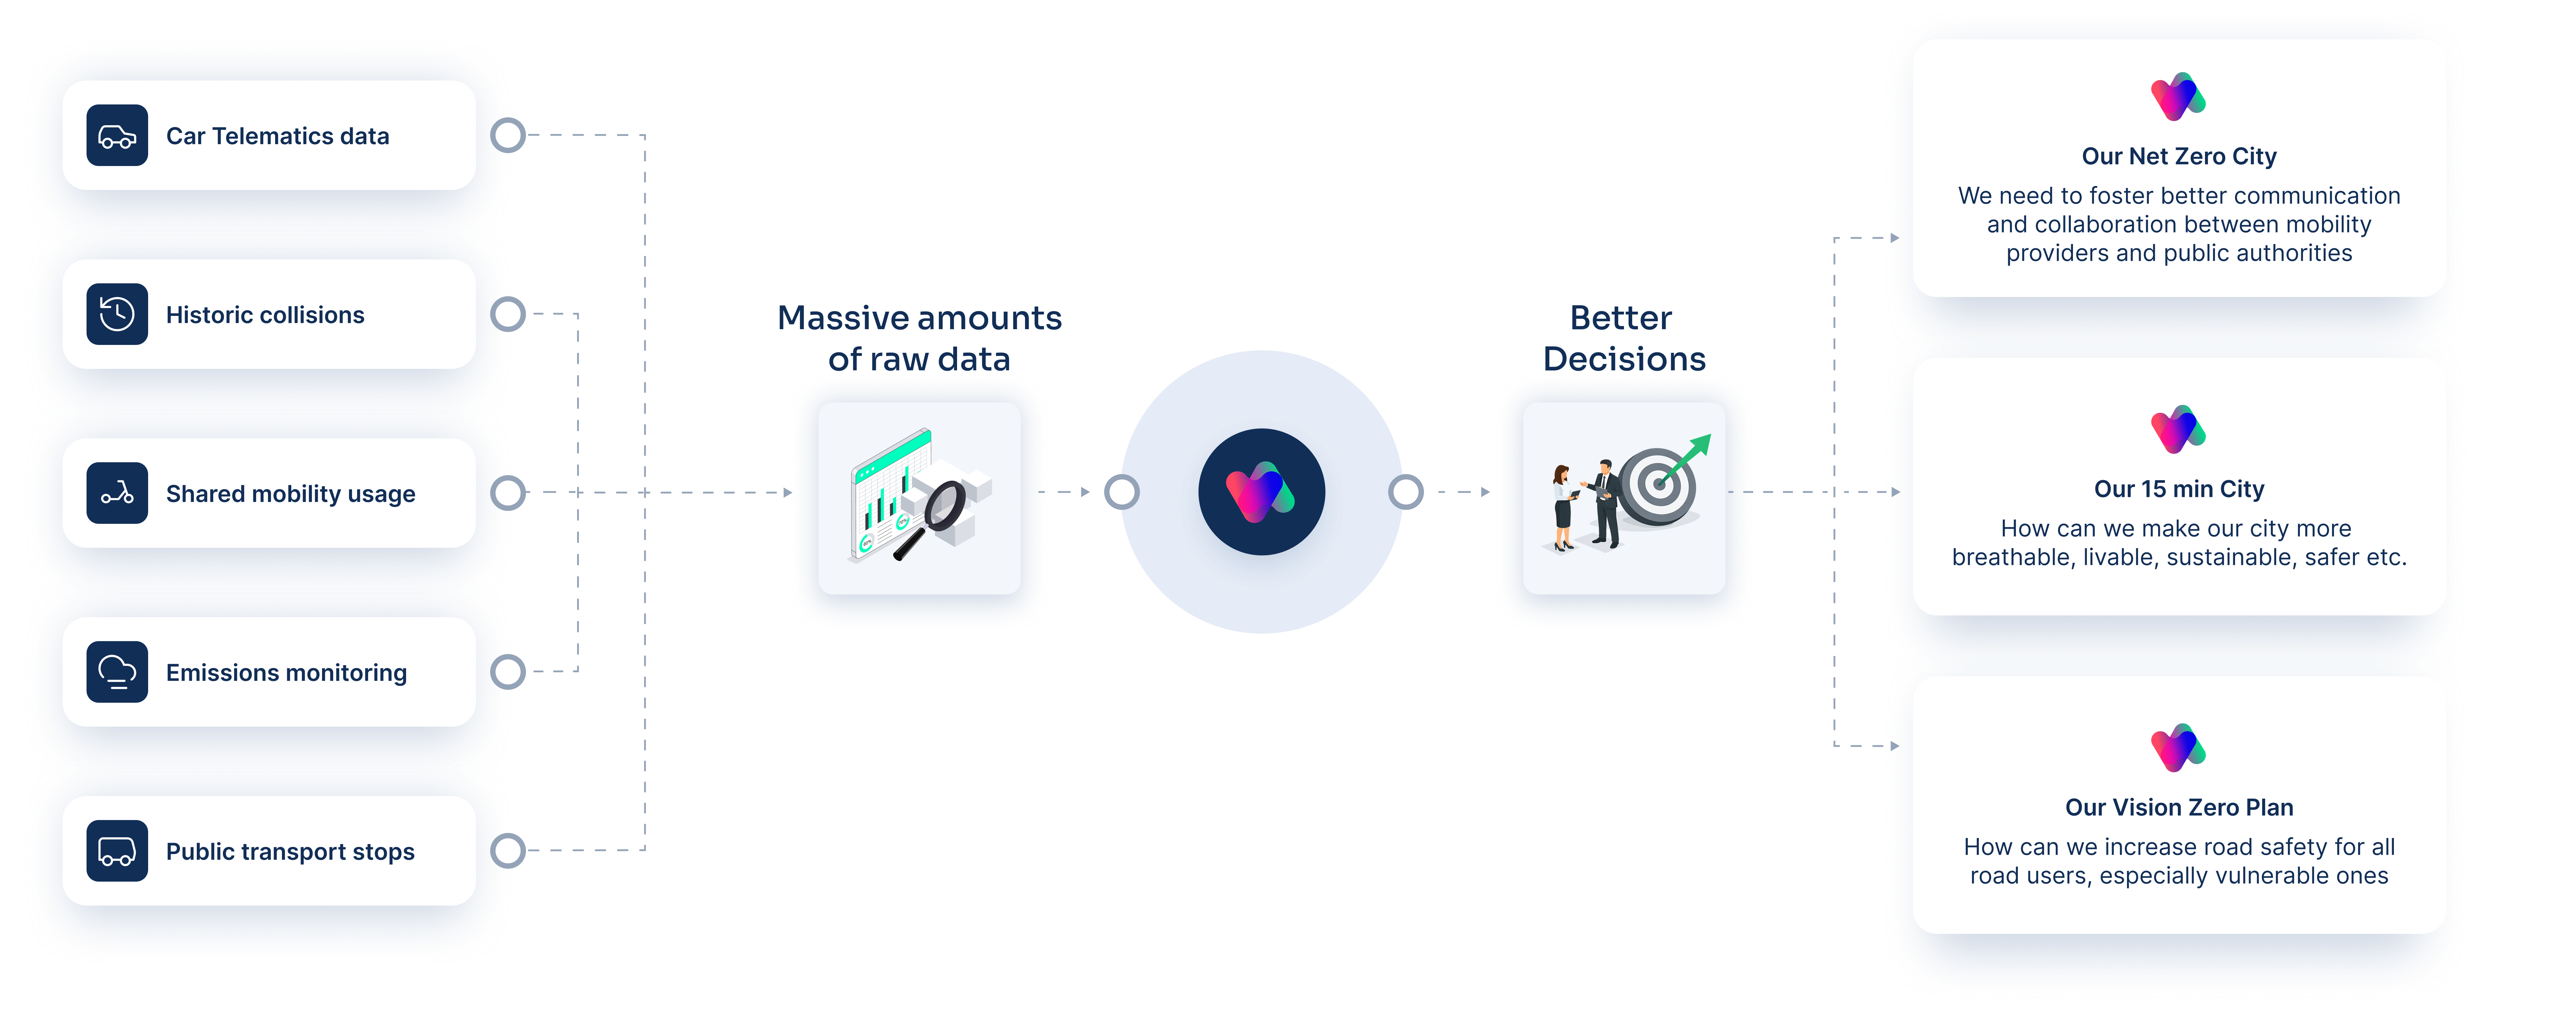
A Connected Ecosystem for Smarter Cities
Driving Events by Vianova
Analyze harsh braking, aggressive acceleration, sharp turns, and speeding to identify high-risk areas. Improve road safety and traffic management with data-driven insights into driving behavior.
Scope: Western Europe & USA
Key Features: Comprehensive Data Insights, Distilled Events, Accurate Risk Assessment, Clustering & Aggregation
.webp)
Traffic Insights by Vianova
Optimize traffic management with real-time data on speed and travel times. Enhance transportation efficiency and improve traffic operations on a granular level.
Scope: Western Europe & USA
Key Features: Updates Every 3 Min, API Integration, Access to the Vianova Intelligence Platform
.webp)
Bike Flows by Vianova
Gain detailed insights into bike traffic patterns on a street segment level. Use daily trip counts from connected bikes and mobile phones to optimize infrastructure, enhance bike safety, and promote sustainable mobility in urban areas.
Scope: Netherlands
Key Features: Street Segment-Level Data, Daily Trip Counts, Comprehensive Data Sources, Interactive Visualization Tools

Pedestrian Flows by Vianova
Gain detailed insights into pedestrian traffic patterns at the street segment level. Use daily trip counts from connected devices to optimize infrastructure, enhance safety, and promote walkability with comprehensive and accurate pedestrian flow data.
Scope: Western Europe
Key Features: Street Segment-Level Data, Daily Trip Counts, Comprehensive Data Sources, Interactive Visualization Tools
.webp)
Origin - Destination Flows by Vianova
Understand travel patterns and mobility trends between zones with aggregated trip counts. Analyze trips by all vehicles, including commercial ones, to gain insights for infrastructure planning, urban development, and traffic management.
Scope: Western Europe & USA
Key Features: Variants (All Trips & Commercial Vehicles), Accurate Trip Count Aggregation, Granual Zone-Based Analysis, Temporal Analysis
%20copy.webp)
Curb Analytics by Vianova
Track real-time or historical stop events of commercial vehicles in any city, observed as individual events. Using Curb Data Specification- compliant attributes, track the pick-up and drop-off activity occurring at the curb.
Scope: Western Europe & USA
Key Features: Event ID, Event Type, Data Source Type, Vehicle ID, Vehicle Type, Propulsion Type, Event Purpose
%20(1).webp)
Hazard Information by Vianova
Enhance traffic operations with real-time updates on local hazards. Utilize data from millions of connected vehicles to identify and respond to events such as broken down vehicles, slippery roads, and severe weather conditions.
Scope: Western Europe & USA
Key Features: Real-time Hazard Detection, High Accuracy and Reliability, Customizable Alerts and Notifications
%20copy%202.webp)
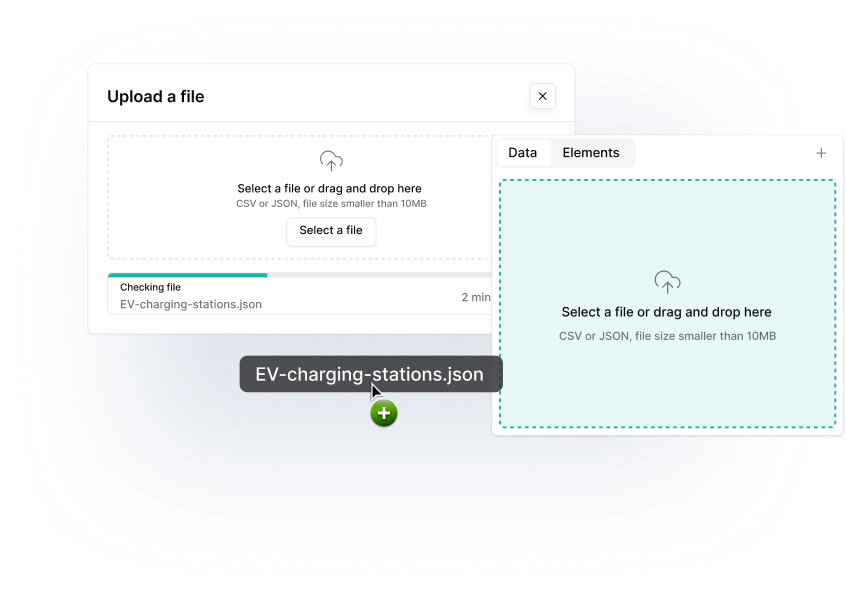
Bring Your Own Data
Securely integrate your proprietary datasets with 150+ mobility data sources — without losing control.
Upload and connect internal mobility, traffic, or infrastructure data while retaining full ownership, access control, and governance.
Combine your data with trusted external sources to generate deeper insights, while ensuring GDPR compliance and enterprise-grade security by design.
Let’s get in touch
Lets talk! We are excited to hear how we can help you solve your mobility challenges.
