
🚗 Predict to Prevent: Why Connected Vehicle Data Is Vital For Achieving Vision Zero
Discover how connected vehicle data can predict and prevent collisions, transforming road safety and accelerating progress toward Vision Zero.

%20(1)%20copy.png)
📩 Stay updated on industry trends & Vianova product updates—subscribe to our Newsletter here!
The Challenge of Achieving Vision Zero
The European Union recently released its statistics around collisions in 2023, announcing 20,400 lives were lost on the road, a 1% decline. While every death is one too many, it highlights a fundamental challenge in road safety planning: collisions, while devastating, are statistically rare events when compared to the trillions of miles driven.
This poses a problem, because for most traffic safety planners, collision data had represented the most comprehensive data set available for achieving Vision Zero. “Black spot” analyses, for example typically involve the identification of a concentrated cluster of collisions over a multi-year period. Once identified, the spot is treated through a combination of physical and behavioral changes.
But this technique has two fundamental flaws:
- First, it waits for enough events to trigger action. In other words, action is only undertaken after multiple people are affected. This technique is rarely satisfactory in other industries- we wouldn’t wait for a number of maritime or aviation disasters to occur before we addressed the problems causing it.
- Second, it assumes that the location of past collisions is a strong predictor of future collisions, and that the best place to apportion resources is the location where collisions have happened in the past.
The Potential of Connected Vehicle Data
The promise and potential of connected vehicle data is that instead of basing planning decisions off of where critical events have happened, we can instead identify areas where they have not happened yet. Understanding the behavior of drivers- their speeding, their swerving, their rapid braking- gives us a window into the types of infrastructure and behavioral conditions that lead to collisions and fatalities.
Analyzing Harsh Braking Data for Prediction
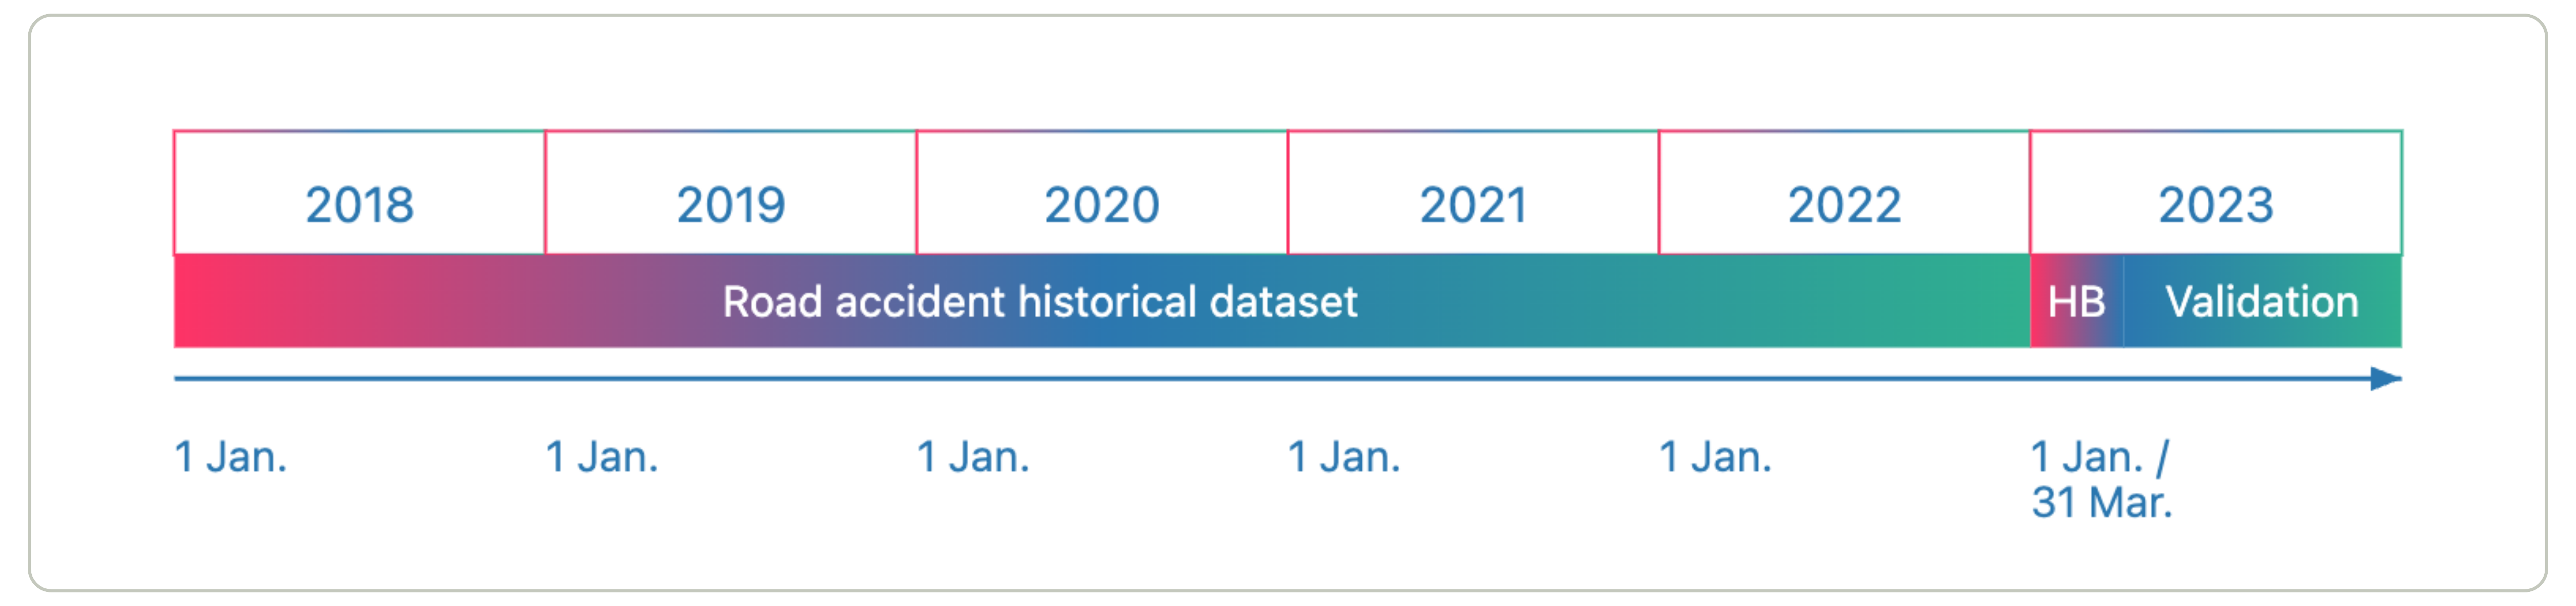
Can the use of connected vehicle data match or exceed the quality of a historic collision-based approach? We’ve run an analysis on both collision data and the types of near miss events in an area of central London. To begin, we built a model which incorporated 5 years of historic collision data, a three month period of harsh braking data, and then a 9 month “validation” dataset of collisions. The objective would be to simulate the process of “predicting” collisions by identifying how many of the data points in the validation dataset could be identified using the historic datasets of collisions and harsh braking.
.png)
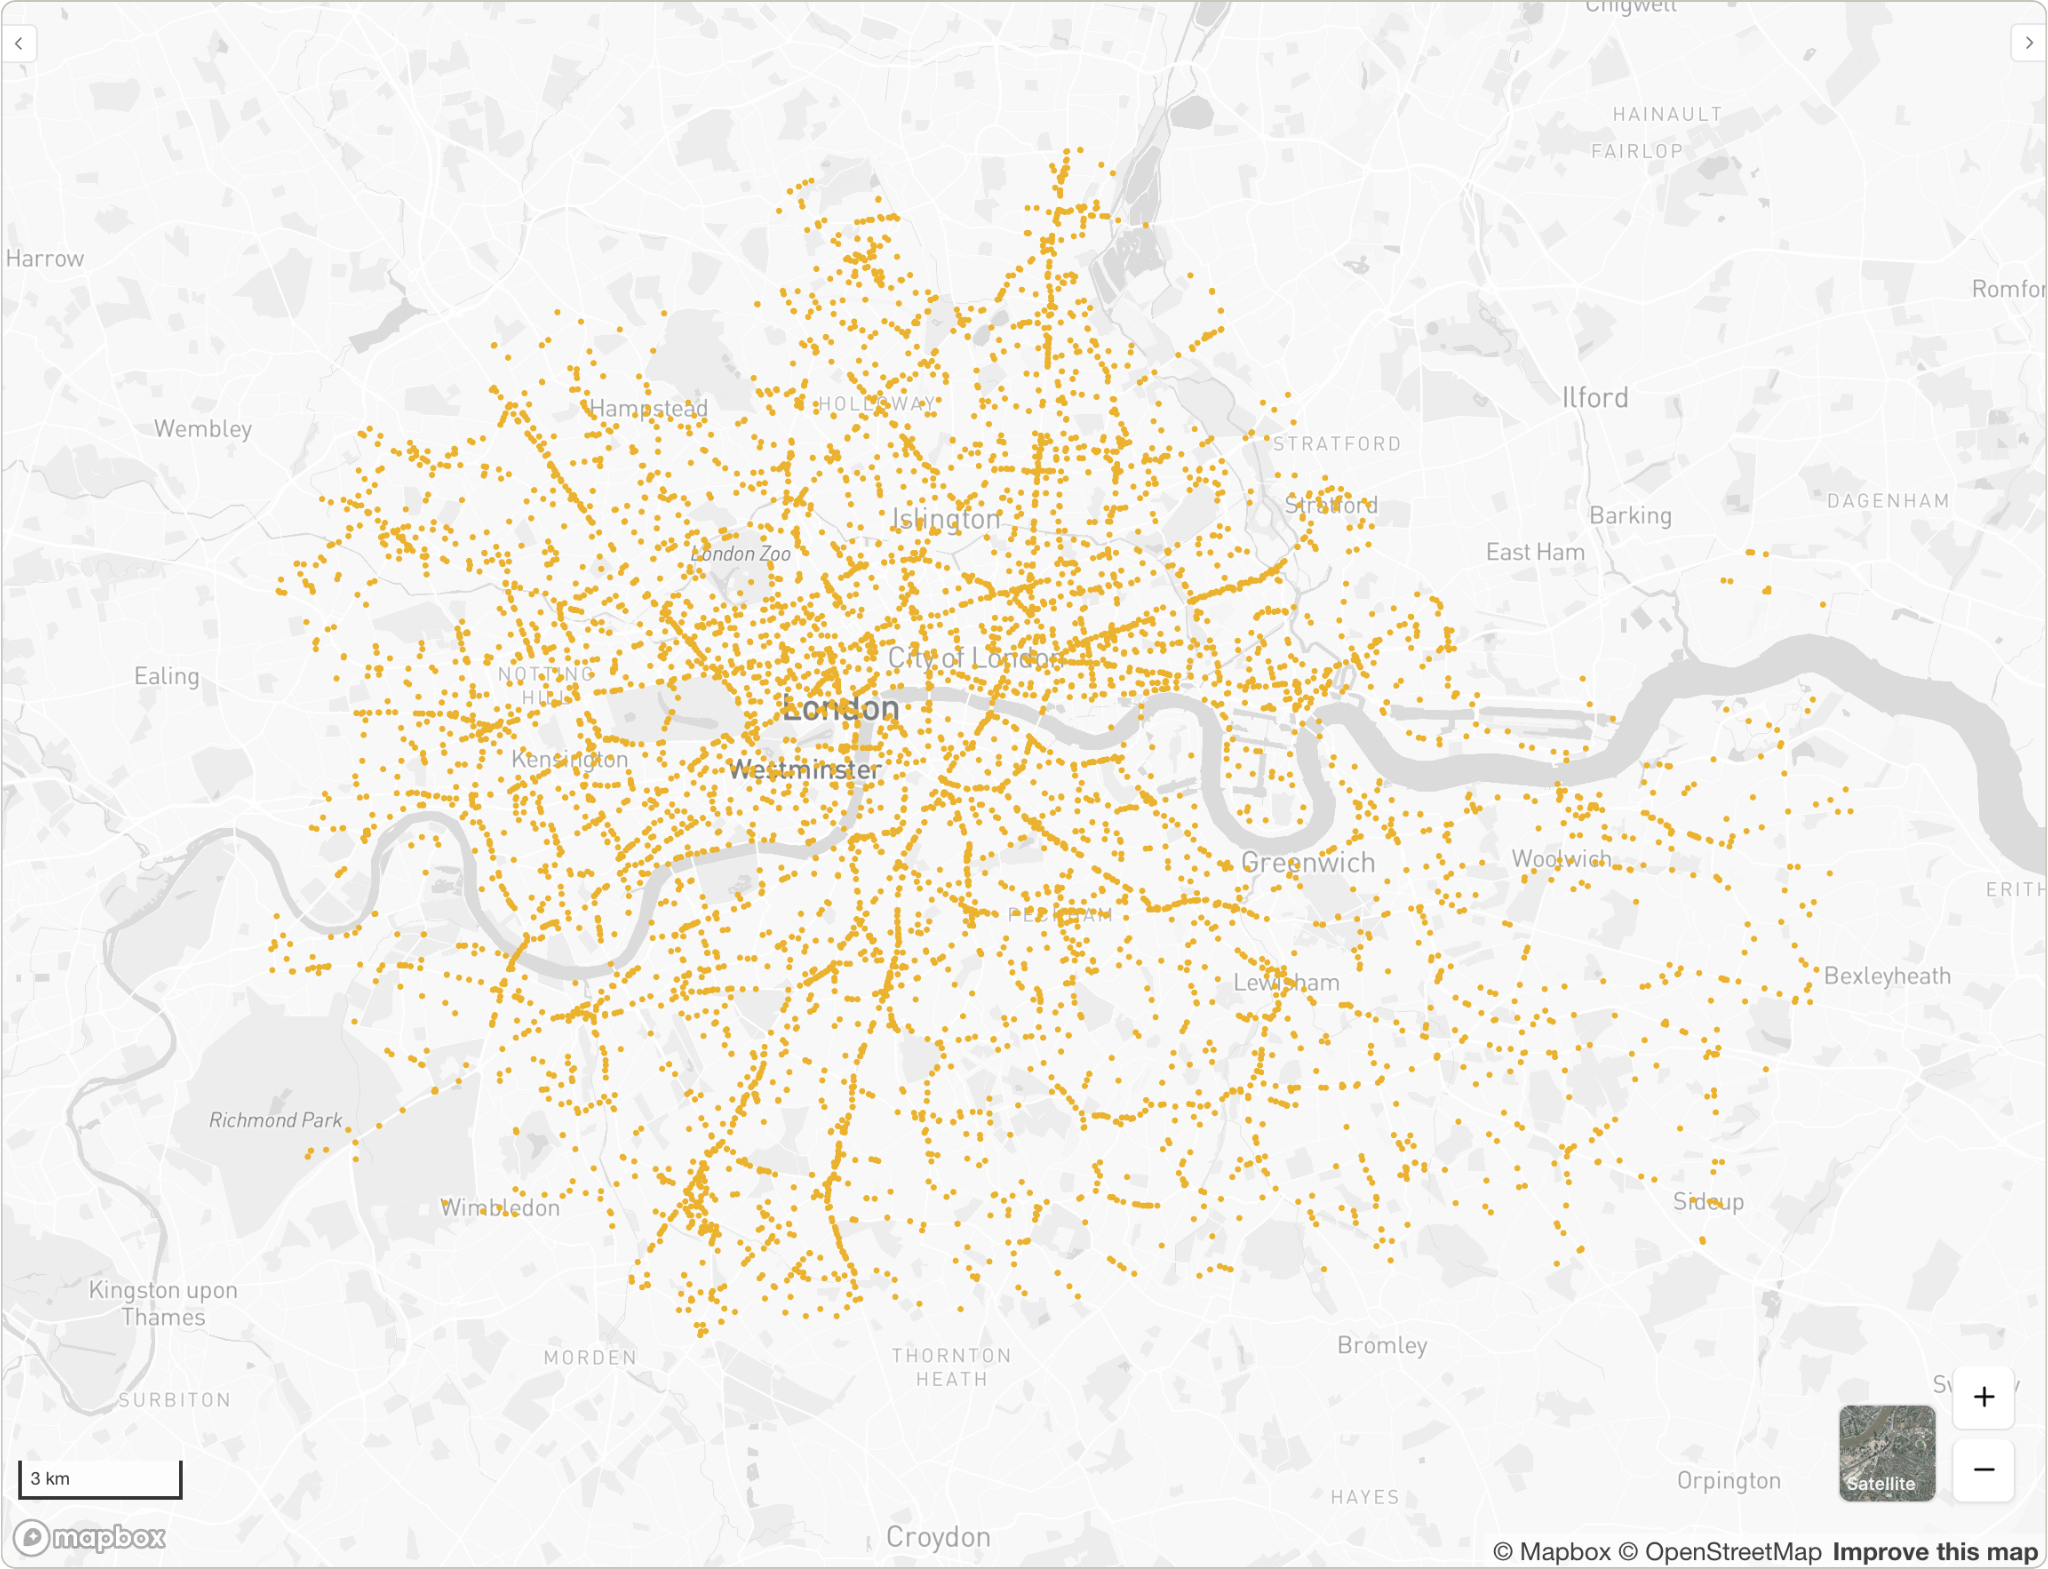
Our analysis looked at three months of harsh braking data, using a clustering algorithm to identify locations where multiple vehicles suddenly braked. This process revealed 2,031 cluster centroids, which we considered as distinct risk locations. Each cluster represents a circle with approximately 75 meters in diameter, comparable to a city block.
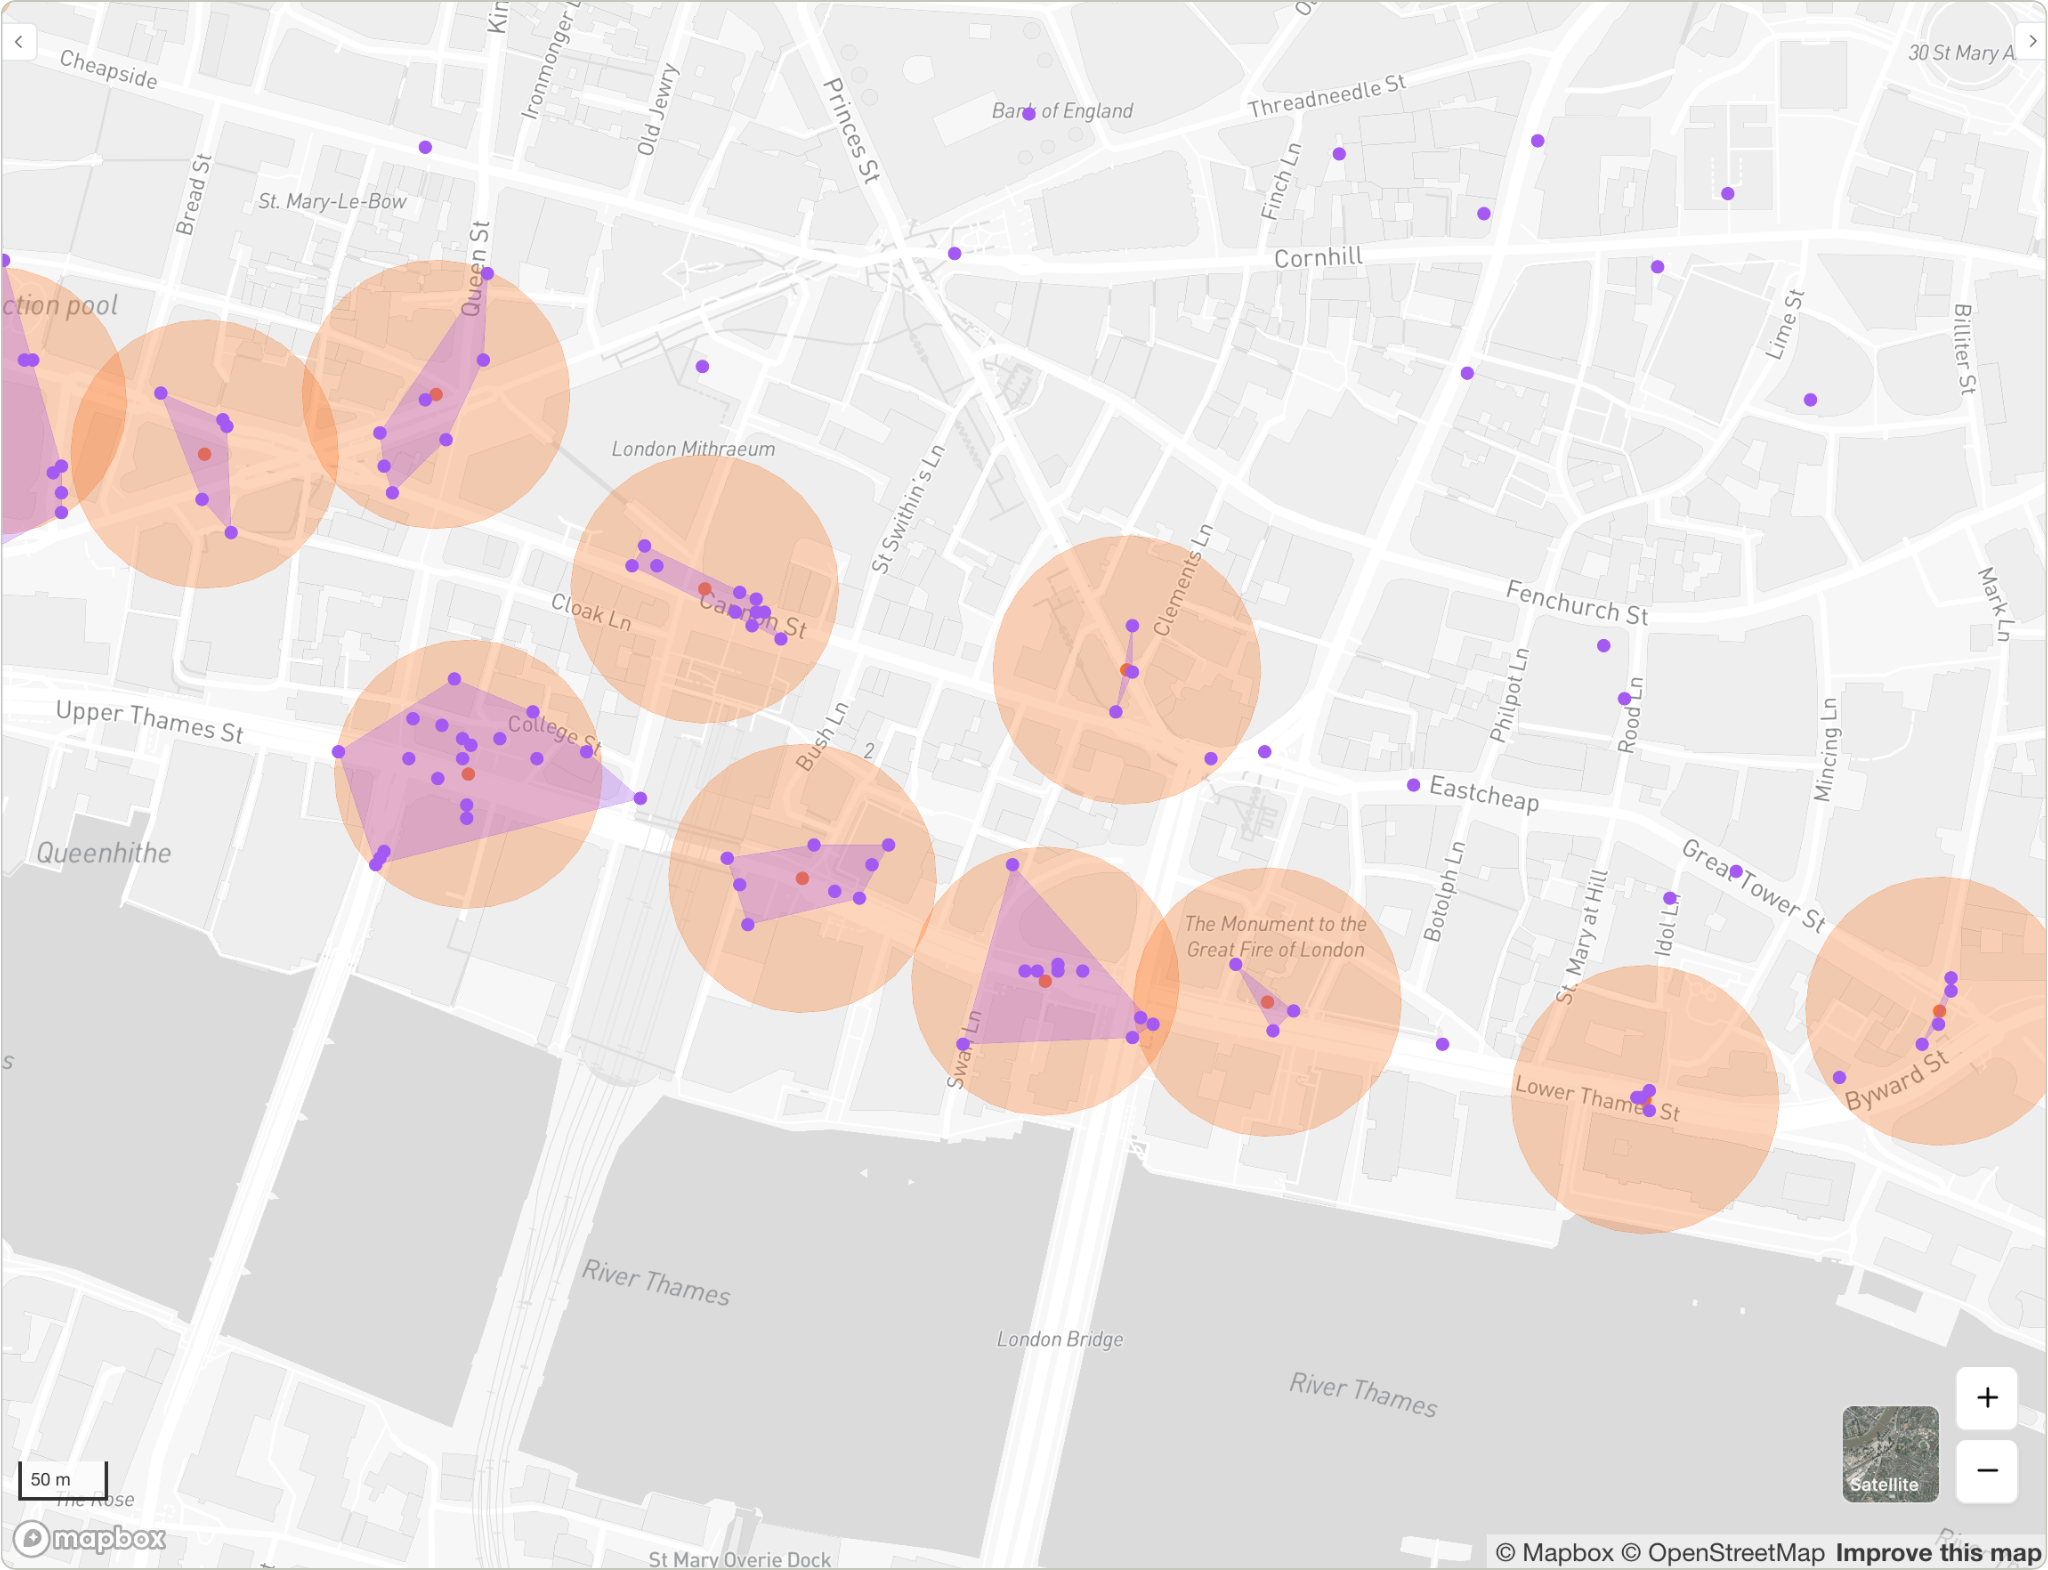
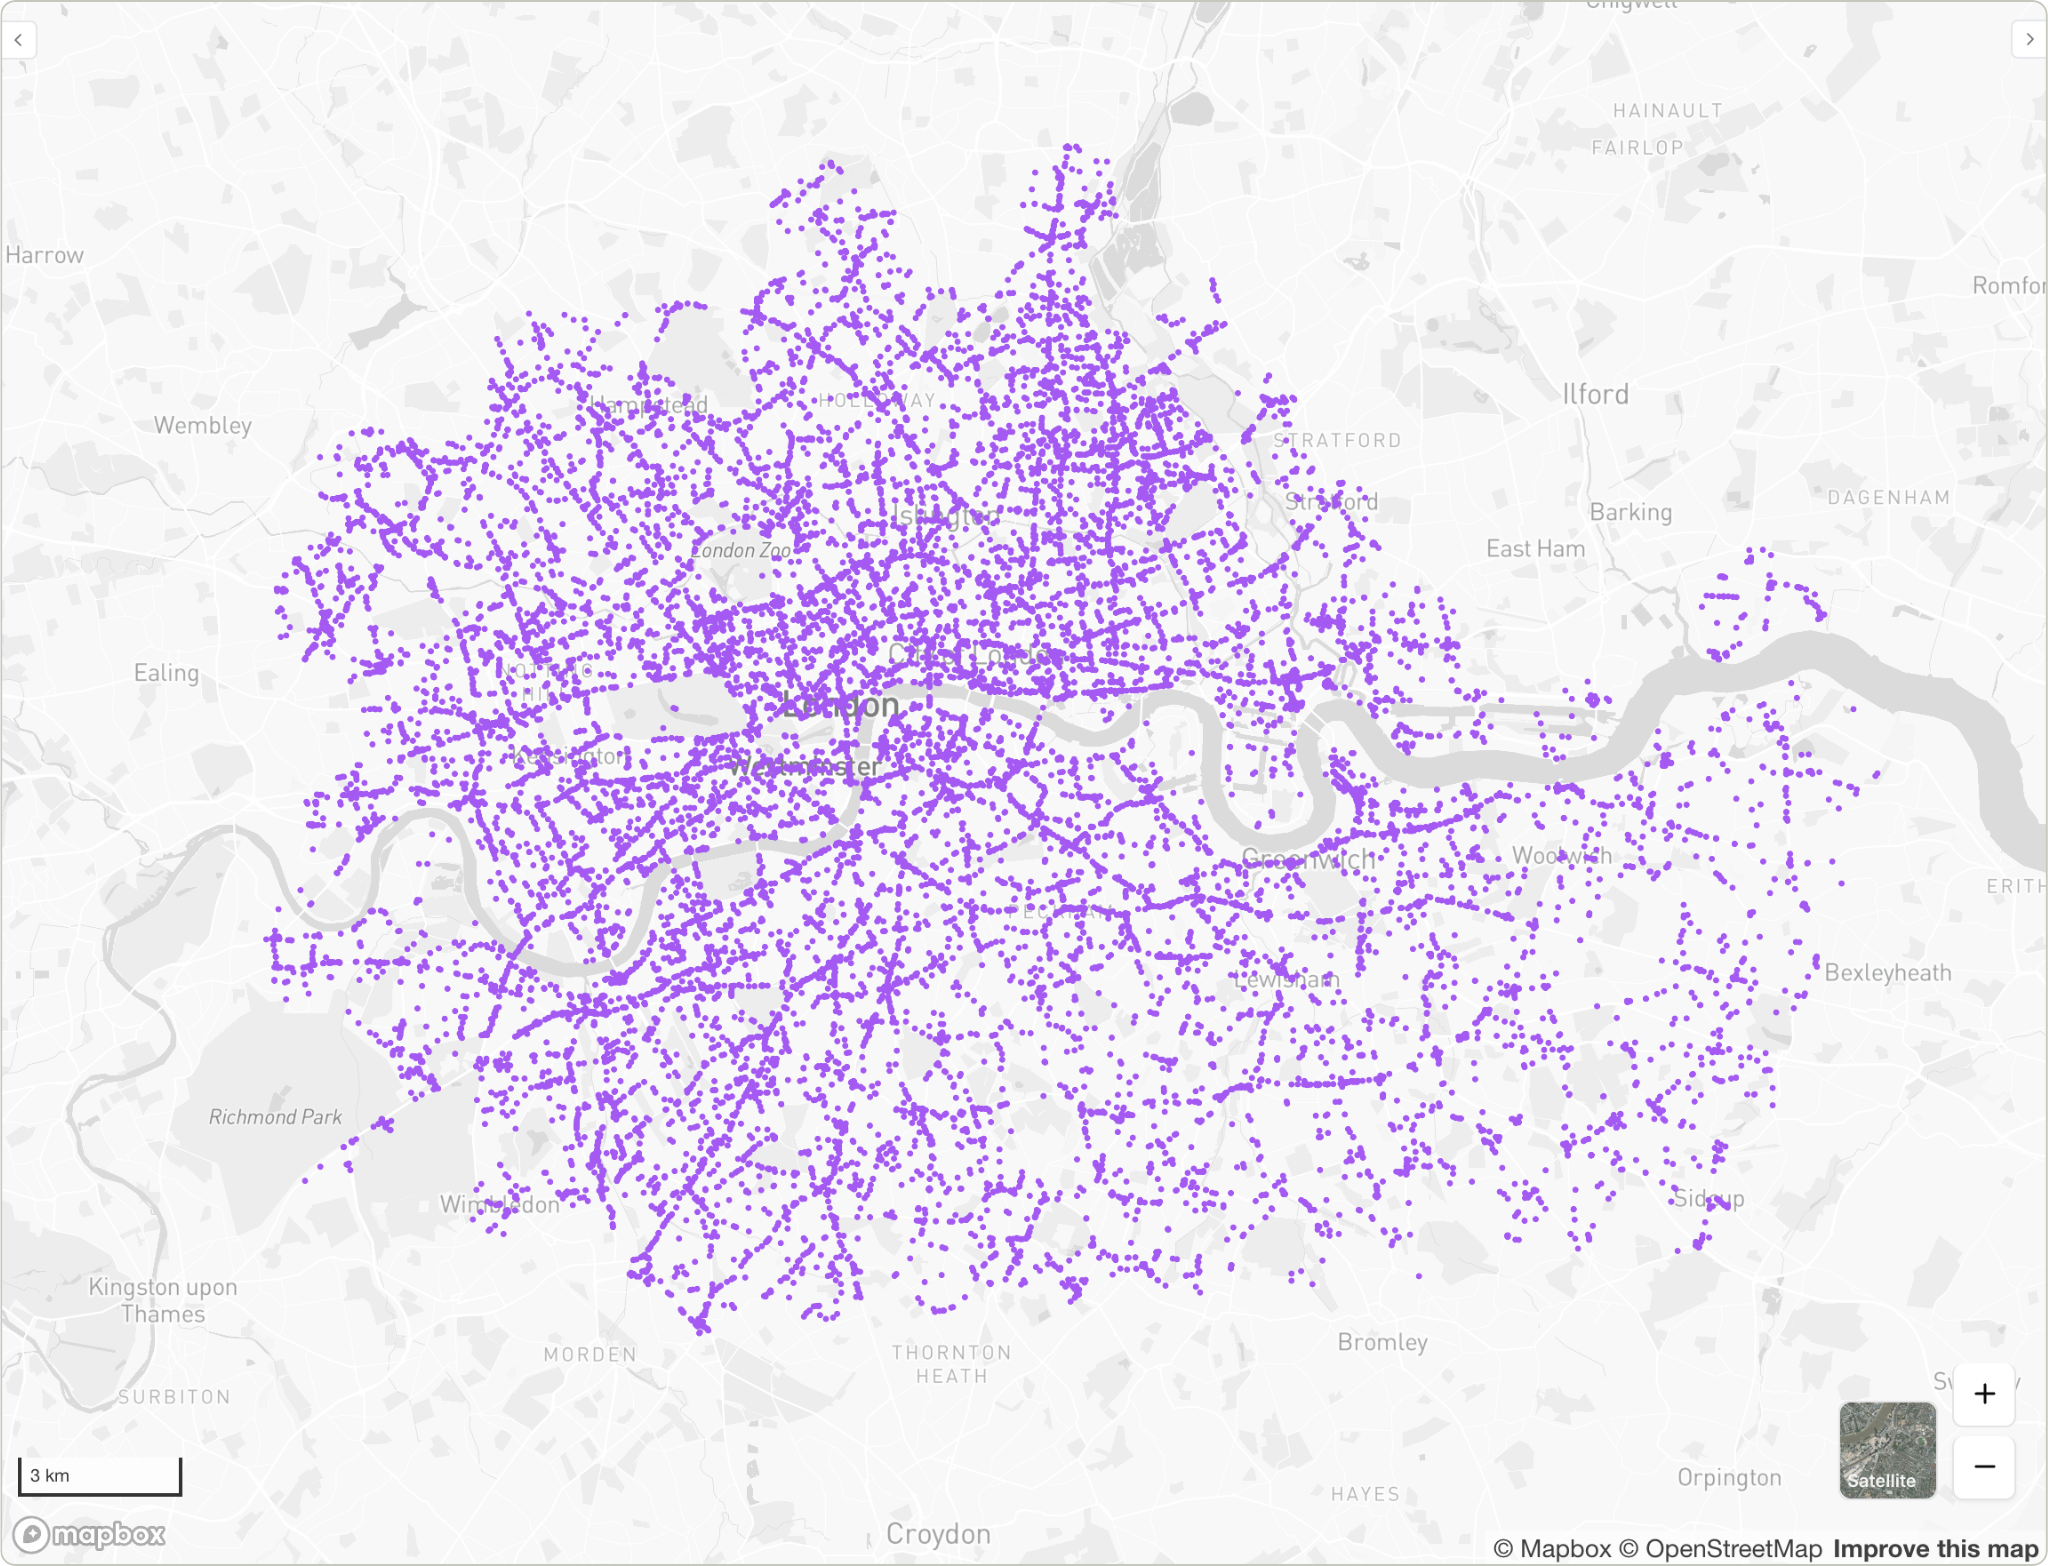
These clusters can be compared to the 6,624 actual collisions recorded over the following nine months in the same area. While collisions represent the most serious outcomes, they're just the tip of the iceberg when it comes to understanding road risk. The performance of this model was compared against two models based on the five years of historic collisions. The first model compared a random sample of 2,031 collisions (ie the same number as the count of harsh braking clusters). The second approach looked at the entire set of collisions over the last five years.
The results revealed compelling evidence for the predictive value of harsh braking data:
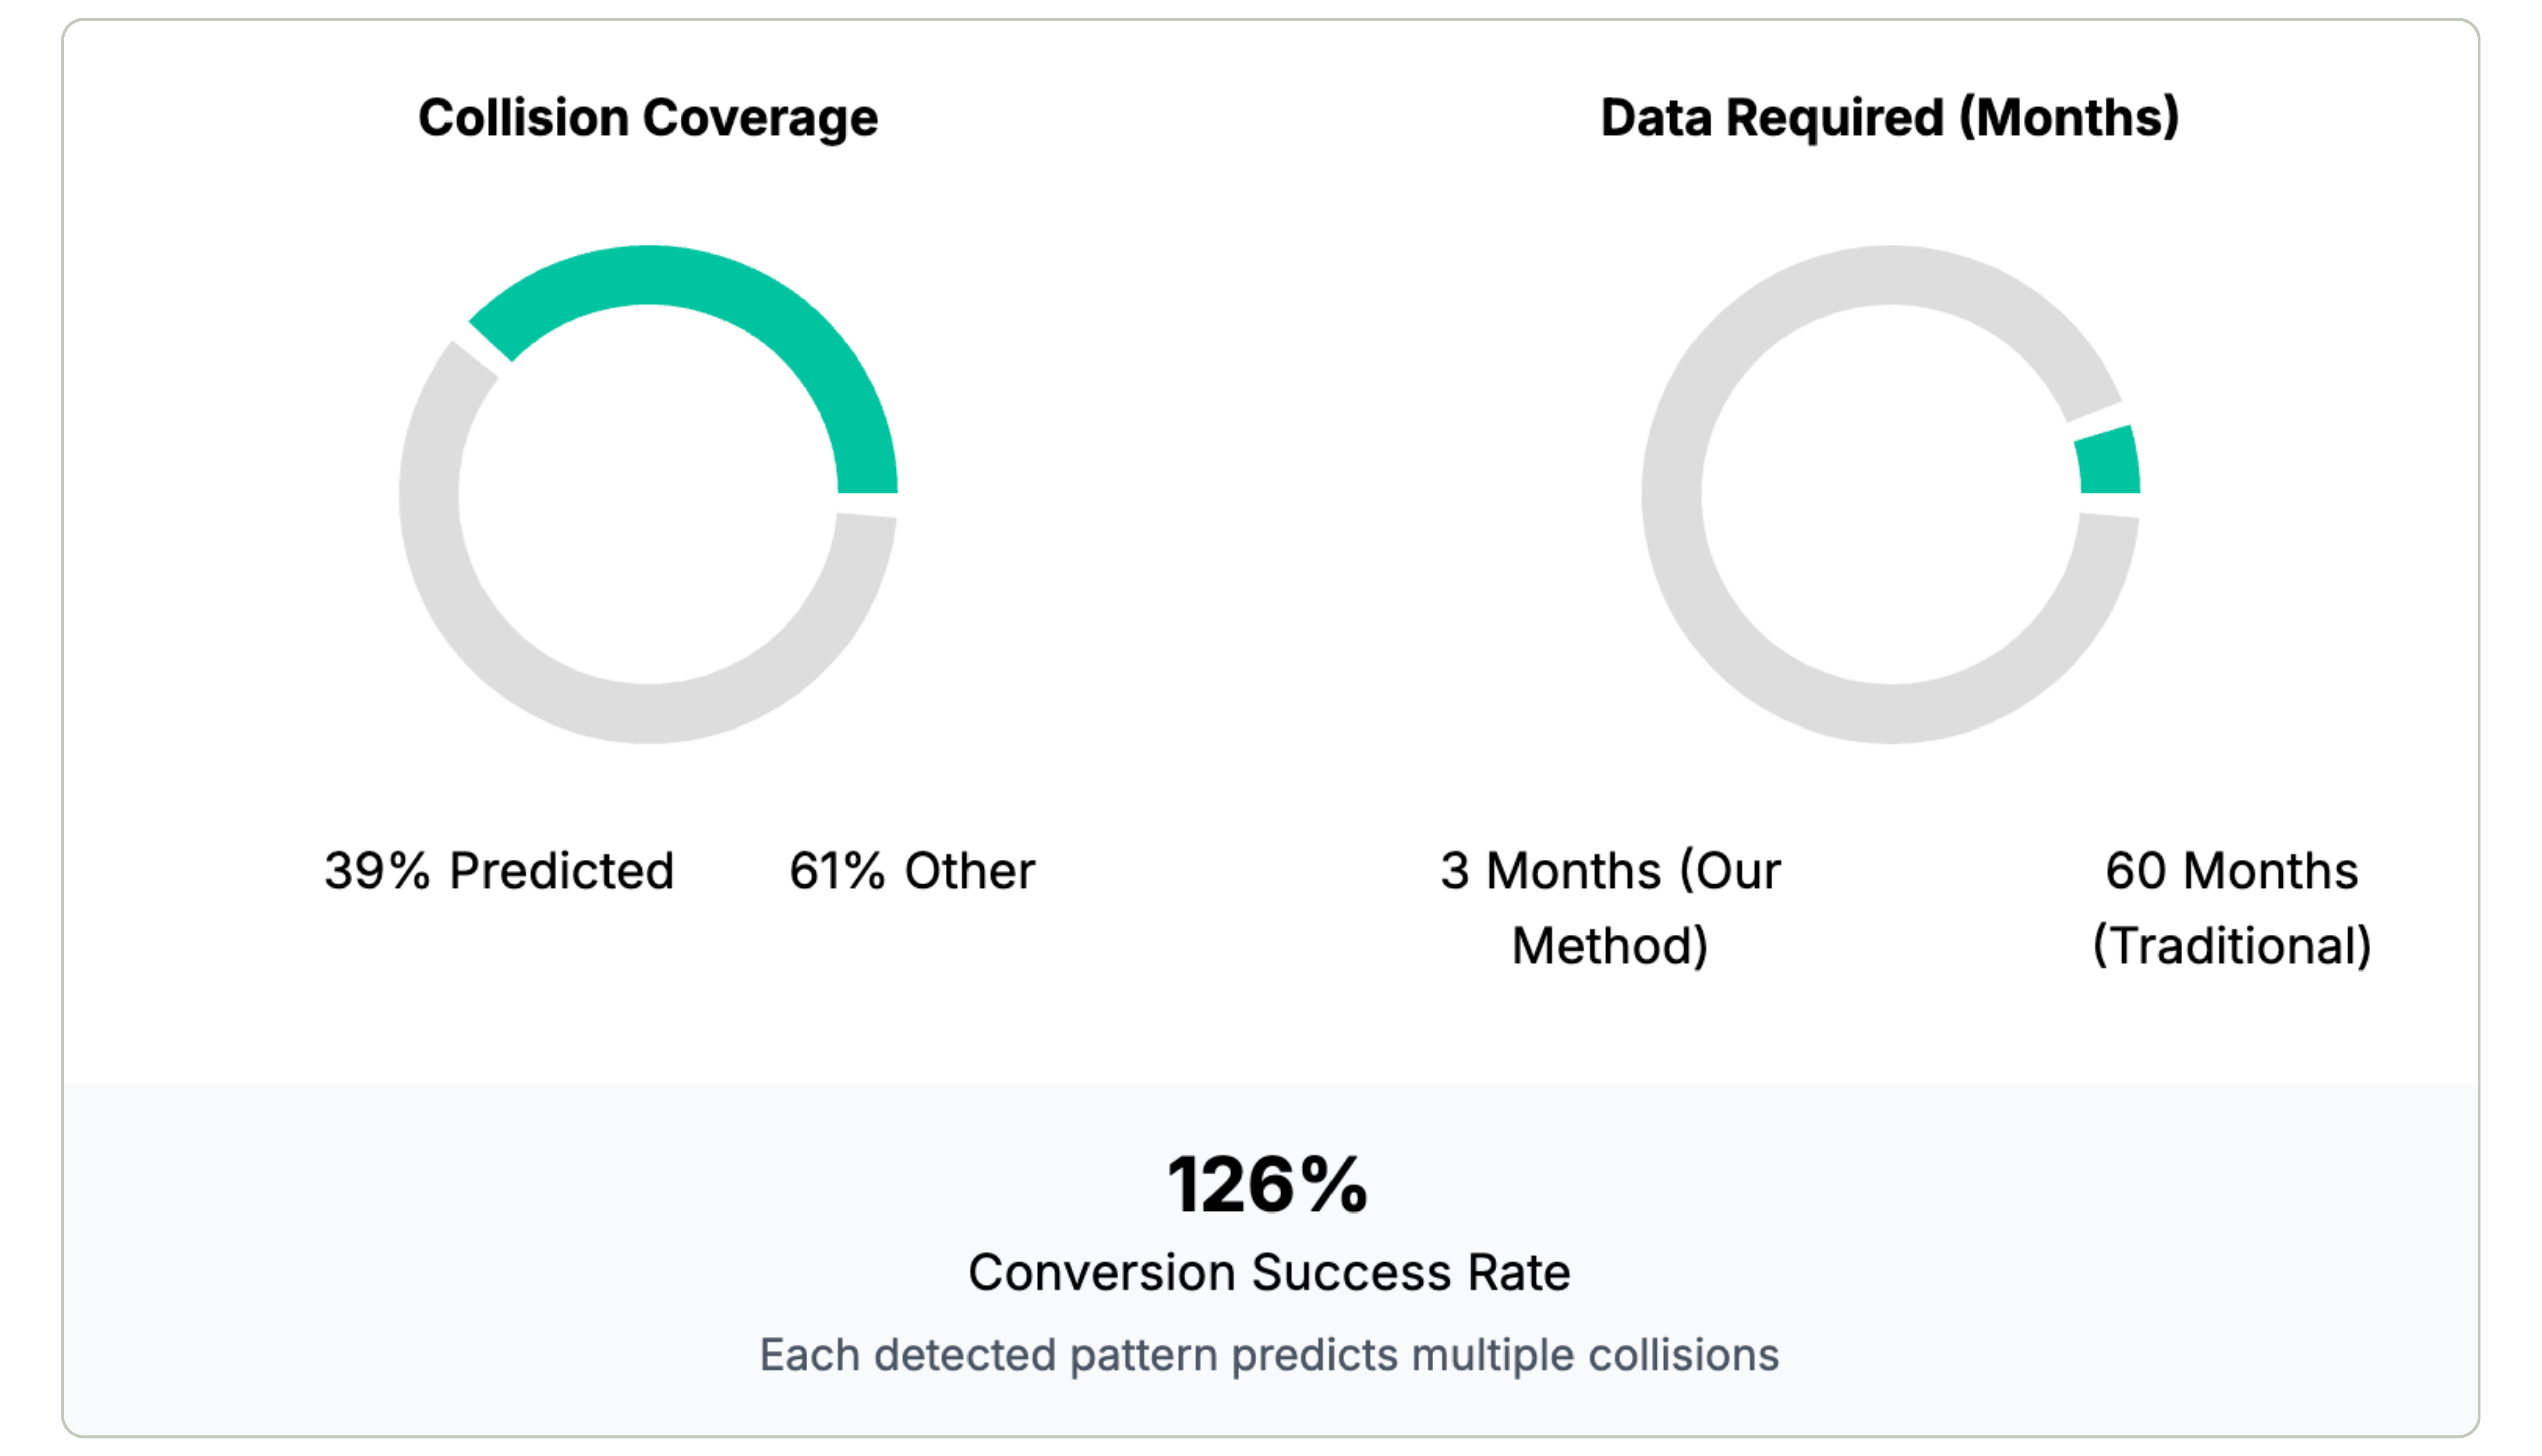
- 39% of future collisions occurred within 75 meters of our identified harsh braking clusters. In other words, using only 3 months of harsh braking data, the model was able to identify the areas where more than 1/3 of the future collisions would occur.
- The approach was 35% more accurate than selecting an equivalent sample from historical collision data
The analysis indicates that there are real advantages to harsh braking data when compared to certain models using collision data. However, we wanted to compare harsh braking data against more realistic collision-based analysis. Most road safety planners don’t focus on the area around every collision, nor do they pick collision sites at random. Instead, they focus on the areas which have the highest density of collisions. So we expanded our analysis to compare the predictive effects of a grouping of harsh brake events vs. a grouping of collisions.
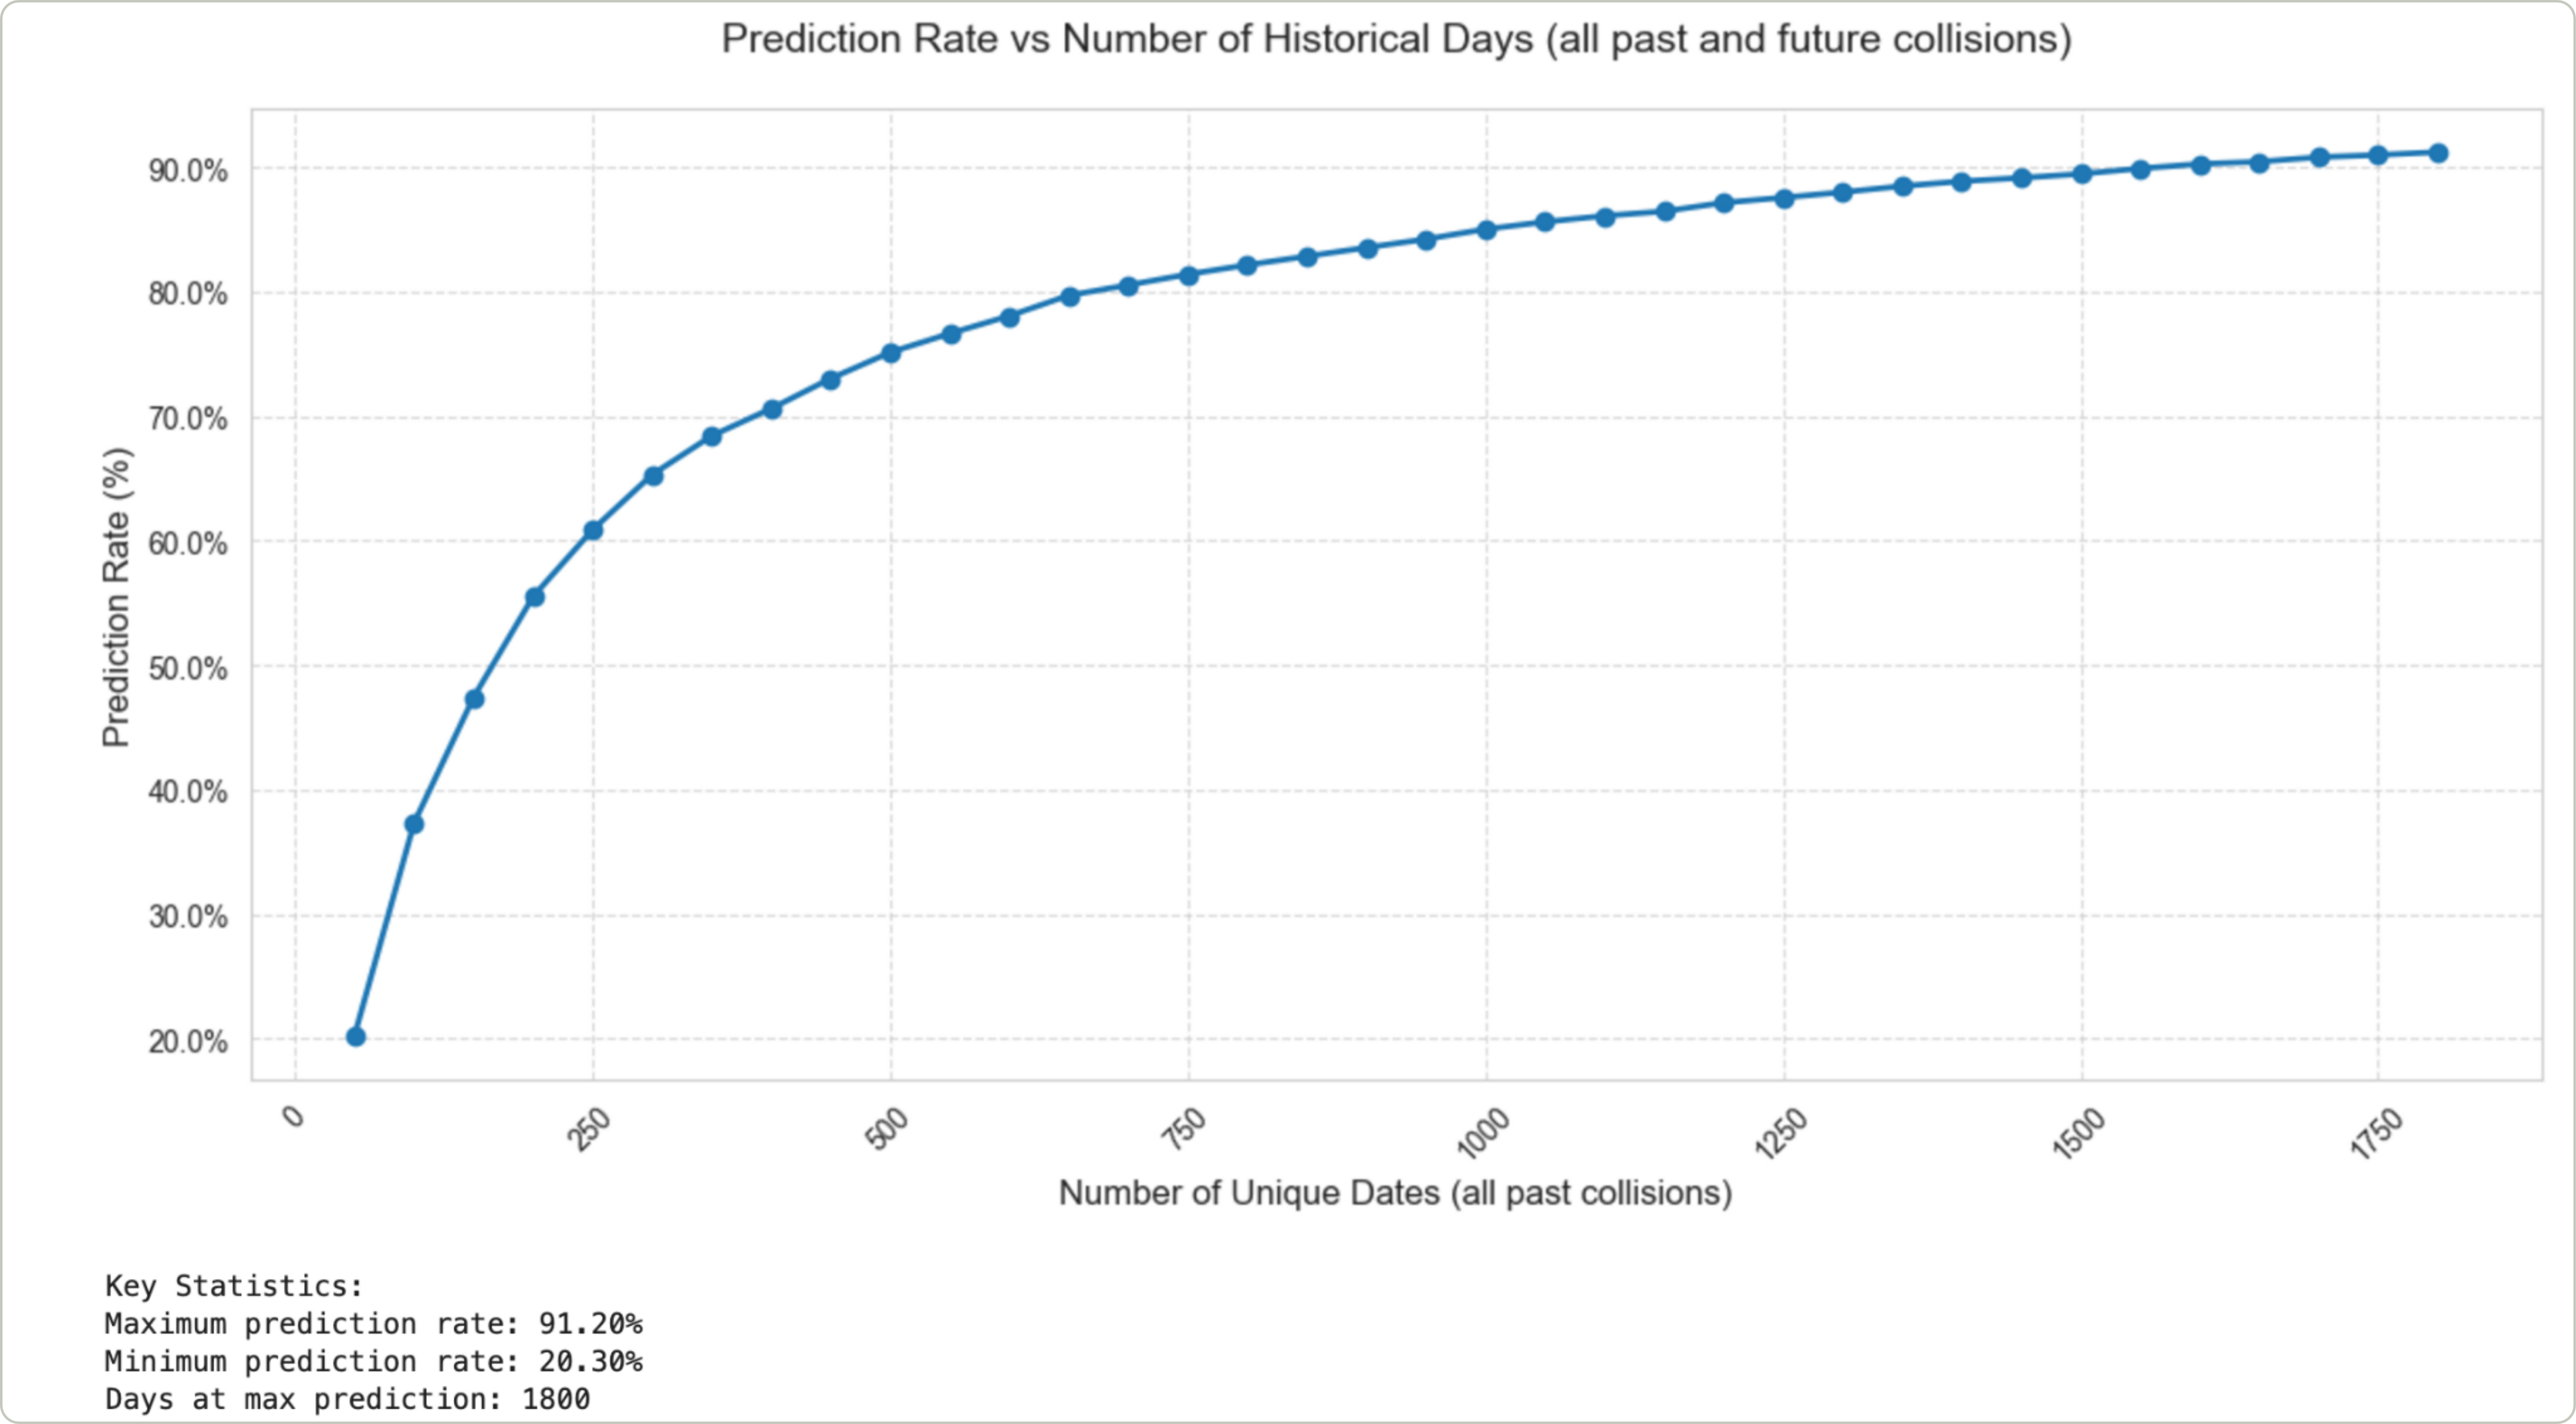
When we extended our analysis using standardized geographic units (H3 hexagons), the results were even more striking. Hexes break the city up into identically sized geographies- so we can compare the count of collisions and harsh brake events in similar areas. Using harsh braking data alone achieved a 71.83% prediction rate with a notably high conversion rate of 57.28%.
However, the combination of both historical collisions and harsh braking patterns, we could predict 93.80% of the hexes with future collisions. Most importantly, we identified 138 hexagonal areas that had no historical collision record but showed harsh braking patterns - and these areas went on to experience future collisions, representing 3% of future collision H3 that would have been completely missed by traditional analysis methods but are identifiable using harsh braking data.
Perhaps most intriguingly, we found that single harsh braking clusters often predicted multiple future collision locations. This suggests that these locations represent persistent risk factors rather than random incidents, making them prime candidates for preventive intervention.
The most striking advantage of behavioral data emerges when considering time requirements. To match the predictive power of just 89 days of harsh braking data, we would need 430 days of historical collision data for general collision prediction. Even more dramatically, for serious and fatal collisions (KSI), we would need an astounding 2,400 days (over 6.5 years) of historical KSI collision data to achieve the same predictive power.
Given changes in travel patterns and vehicle technology over a time period that long, it would be difficult to trust the consistency of data going that far back. But the same level of predictability could be unlocked with a much smaller data collection period by working with connected vehicle data. This dramatic difference - 89 days versus 6.5 years - demonstrates why behavioral data represents such a revolutionary approach to road safety planning.
The Advantages of Connected Vehicle Data
The advantages of this connected vehicle-based approach extend beyond just prediction. Cities can:
- Identify risk areas before collisions occur
- Monitor the impact of interventions in near real-time through changes in driver behavior
- Target resources more efficiently at locations showing patterns of risky behavior
- Validate the effectiveness of safety improvements without waiting for collision statistics
While harsh braking patterns represent just one type of behavioral data, our research demonstrates its significant value in predicting and preventing road safety issues. By combining this with other connected vehicle data streams, cities can build increasingly sophisticated models for proactive safety management. This approach doesn't just help reduce harm - it helps prevent it from occurring in the first place.
About Vianova
Vianova is the data analytics solution to operate the mobility world. Our platform harnesses the power of connected vehicles and IoT data, to provide actionable insights to plan for safer, greener, and more efficient transportation infrastructures.
From enabling regulation of shared mobility to transforming last-mile deliveries, and mapping road risk hotspots, Vianova serves 150+ cities, fleet operators, and enterprises across the globe to change the way people and goods move.
Ready to learn more? Visit our page to get in touch.
👉 Read our previous blog here!
.png)


Become part
of the movement
in the Vianova world.
Let's get in touch
Lets talk! We are excited to hear how we can help you solve your mobility challenges.